Question 43Asked in DSSSB TGT Computer Science, 7 Feb 2024, Shift 2 (12:30 PM)

The line chart given below shows the production of 6 companies in 2 years P and Q. J1 = The total production of all companies in year P. J2 = The total…
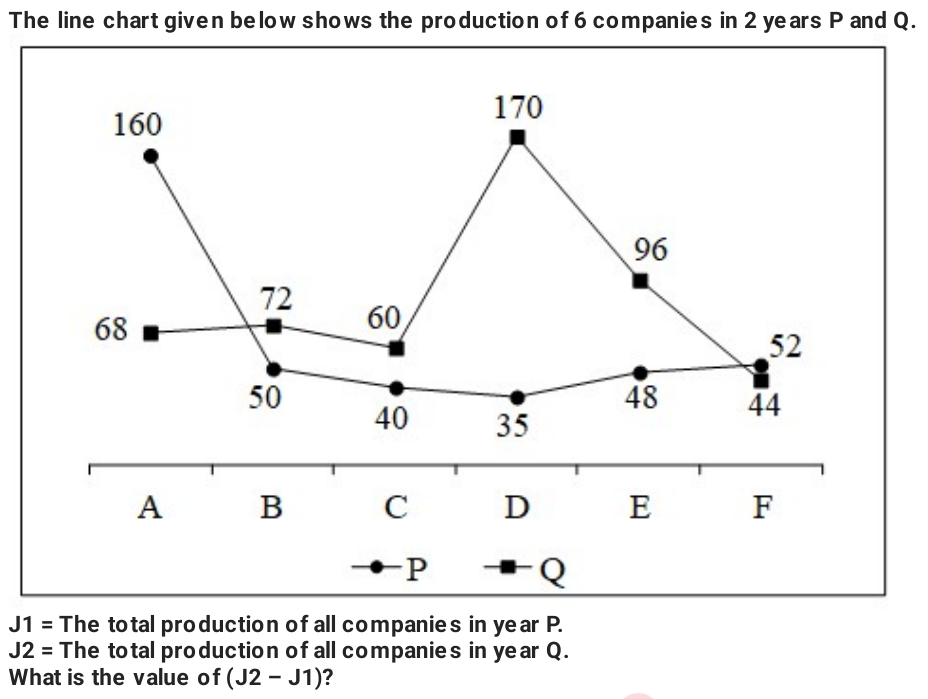
The line chart given below shows the production of 6 companies in 2 years P and Q. J1 = The total production of all companies in year P. J2 = The total production of all companies in year Q. What is the value of (J2 – J1)?
  1. A125
  2. B110
  3. C150
  4. D85
Show answerHide answer

Correct answer: (A) 125

Explanation

From the chart, year P total = 160+50+40+35+48+52 = 385 and year Q total = 68+72+60+170+96+44 = 510. So J2 − J1 = 510 − 385 = 125.

From DSSSB TGT Computer Science PYQ, 7 Feb 2024, Shift 2 (12:30 PM)

This is question 43 of DSSSB TGT Computer Science PYQ, 7 Feb 2024, Shift 2 (12:30 PM). See all questions of this paper with answers, or attempt the paper as a timed online test to get your score and all-India rank.